Rで色つきの相関係数行列を作る方法
多変量のデータを分析する際に、相関係数行列を作成して変数間の関係を見たいときがあります。
相関係数行列自体はstats::corで作成できすが、このままでは資料に使いづらいです。
x <- rnorm(100, 0, 1)
y <- rnorm(100, 0, 1)
z <- rnorm(100, 0, 1)
w <- rnorm(100, 0, 1)

df <- data.frame(cbind(x, y, z, w))

cor(df)

> cor(df)
            x          y                 z                   w
x  1.00000000 -0.1118585 0.06692407  0.11453778
y -0.11185852  1.0000000 0.12882490 -0.11356673
z  0.06692407  0.1288249 1.00000000  0.02012544
w  0.11453778 -0.1135667 0.02012544  1.00000000
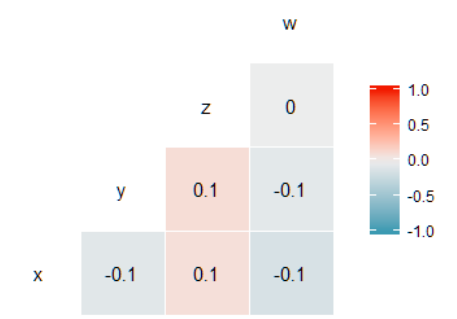
キレイに色つきで相関行列を作ってくれる関数としてはGGally::ggcorrなどがあると思います。
library(GGally)
library(ggplot2)

ggcorr(df, label = TRUE)

GGally::ggcorrでは引数によって見え方を変更できます。以下の記事が網羅的だと思います。
ggcorr: correlation matrixes with ggplot2
ただ、階段状に相関係数行列を見せるやり方は個人的に見辛いです。
できれば以下のような形式が見たいです。

ググってみてもでてこなかったため、自分で関数を作りました。
# correlation_matrix
# input : dataframe
# output : correlation matrix graph
correlation_matrix <- function(df) {
  # gets columns names
  colnames <- names(df)

  # change data.frame into matrix
  # and if there are non-numeric columns , convert them into numeric
  mat <- df %>%
    sapply(as.numeric)

  # create correlation matrix
  cormat <- cor(mat)

  # prepare parameters for ggplot
  n <- ncol(cormat)
  x <- c()
  for (i in 1:n) {
    x <- append(x, rep(i, n))
  }
  y <- rep(1:n, n)

  # convert matrix into dataframe
  cormat <- data.frame(cormat) %>%
    gather(key = "type", value = "value") %>%
    mutate(x = x, y = y)

  # create correlation matrix with color scale
  cormat %>% ggplot() +
    geom_tile(aes(x = x, y = y, fill = value)) +
    geom_text(aes(x = x, y = y, label = round(cormat$value, 2)), size = 3) +
    scale_x_continuous(breaks = 1:n, labels = colnames) +
    scale_y_continuous(breaks = 1:n, labels = colnames) +
    theme(axis.title.x = element_blank(),
          axis.title.y = element_blank()) +
    ggtitle("Correlation Matrix") +
    scale_fill_gradient(low = "white", high = "red", name = "scale")
}
結果は以下のようになります。
# function test
x <- rnorm(100, 0, 1)
y <- rnorm(100, 0, 1)
z <- rnorm(100, 0, 1)
w <- rnorm(100, 0, 1)

df <- data.frame(cbind(x, y, z, w))

correlation_matrix(df)

自分好みの相関係数行列が得られました。
試しに、実際のデータで相関係数行列を作ってみようと思います。
以下で作成したNBAのデータを使用します。
library(nbastats)
library(tidyverse)
library(GGally)

# target columns
targets <- c(
  "G",   # games
  "MP",  # minutes played
  "FG",  # field goals
  "3P",  # 3 point field goals
  "2P",  # 2 point field goals
  "FT",  # free throws
  "AST", # assists
  "STL", # steals
  "BLK", # blocks
  "TOV", # tunrovers
  "PF",  # personal fouls
  "PTS"  # points
  )

# filter 2017 records
stats <- seasons_stats %>%
  filter(Year == 2017)

# remove unnecessary columns
stats <- stats[, targets]

# create correlation matrix
correlation_matrix(stats)

自作の関数を使って相関係数行列が作成できました。
結果を少し見てみて、以下のような分析をしてみました。
・3P(3ポイント成功数)とBLK(ブロック数)はほとんど相関がない。(0.13)
⇒シューターは小柄な選手が多いためブロック数は少ない?
・AST(アシスト数)とBLK(ブロック数)はほとんど相関がない。(0.23)
⇒アシスト数が多いゲームメイカーは小柄な選手が多いため、ブロック数が少ない?
・AST(アシスト数)とTOV(ターンオーバー数)は相関が高い。(0.89)
⇒アシスト数が多いゲームメイカーはパスを出す回数が多いため、その分ターンオーバー数も多い?
以上